
|
Lorna Mills and Sally McKay
Digital Media Tree this blog's archive OVVLvverk Lorna Mills: Artworks / Persona Volare / contact Sally McKay: GIFS / cv and contact |
View current page
...more recent posts
Email from Ethel and the Mermen

The Godlike Genius of Scott Walker:
Big Louise
Jackie
My Death
(VB via SM)
| On Charlotte Gainsbourg's album, IRM (produced by Beck) she uses the audio environment of the MRI scanner as musical influence. When I was in the MRI scanner I started to get really interested in the sound. It was like some kind of crazy industrial techno punk thing, loud and abrasive, but almost sort of rhythmic and almost sort of harmonic. Gainsbourg gets it really well in this song. I knew that the noise came from the magnetic coils, but I just learned at school that it's because the coils heat up when they are turned on and so they expand & contract, creating friction with the polymer that encases them. |

OK carry on.
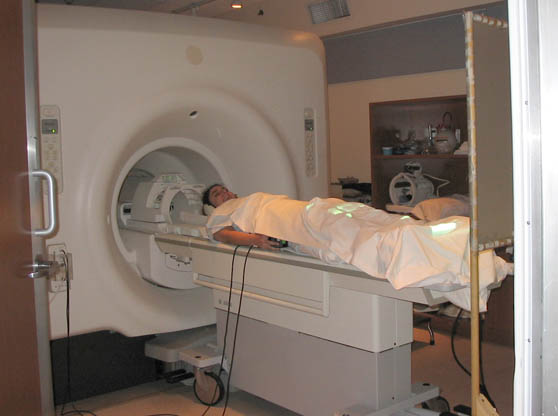 Yes that's me, going in for fMRI when I volunteered for a neurology study at Sunnybrook hospital. I was in there for several hours on several occasions. I made a lot of notes on what it's like to be inside the scanner, but we'll save that for another day. I'm auditing a class called "Introduction to fMRI." Disclaimer in case anyone winds up here because they are looking for actual neuroscience: I'm not a scientist and I don't have a fucking clue what I am doing! Our teacher says that the MRI scanner is not a black box. He wants his students to be able to explain how it works. So here goes, in my own words. If you have any self respect, you will not quote me on this. MRI stands for Magnetic Resonance Imaging. It used to be called NMR, Nuclear Magnetic Resonance, but they changed the name in the 70s because people at the time were so freaked out by nuclear technology of any kind. An MRI scan produces a static, anatomical image of the brain. The 'f' in fMRI stands for functional. fMRI scans are series of static images that show changes in brain activity over a period of time (like animated gifs). Anatomical MRI scans are usually at a higher resolution than fMRI scans, because the scan itself can take longer. The basic unit in these digital images is a voxel, which is like a 3D version of a pixel. Voxels can be bigger (low rez) or smaller (high rez) depending on how much time you take. Okay. 1) How do you use magnets and radio frequencies to collect data about someone's brain? 2) How do you specify exactly what you want to measure within the brain? 3) How do you translate your data into an image, or series of images? I can almost barely manage to discuss the answer to 1; I have even less of a grip on 2; we're just getting started on 3 and so far it is just plain mind-boggling. Shall we begin? 1) The scanner contains a really big, really powerful magnetic coil that is always on. When someone's head is inside this static magnetic field, the protons in their hydrogen atoms tend to "spin" together in one direction. Spin is a quantum term and doesn't really mean spin like we experience it. This is the bit where Richard Feynman would say something like "if you think you understand it you don't understand it." So just think of spin as a bit of a metaphor, but one that's fairly apt. Anyhow, a lot of the protons get lined up (the stronger the field, the more alignment). This is the state that they need to be in to get measured. The scanner also contains radio frequency (RF) coils that can be turned on and off quickly. Once the protons are lined up because of the magnet, the RF kicks in and flips some of them into higher energy states. When the RF is switched off, the protons flip back down to the lower energy state. This switching back down is a release of energy (the exact same amount of energy that the RF coils introduced). This means that each proton that is shifting releases a photon, create a radio frequency. The scanner also has a set of RF detector coils that pick up the frequency and thereby notice when the photons are released. That's the data. (Some scanners use the same RF coils to both induce and receive the frequencies, some have separate coils, but in either case the RF is always the same coming out as going in). 2) This bit is super technical and I'm unable to fully digest it. Here's what I've got. The magnetic and RF fields are not uniform, but gradient, meaning that they change along a spatial plane. So different frequencies can be correlated with different physical locations, ie: the field is passing through somebody's physical head, and the field is different, and producing different effects, in different areas of the brain. As mentioned above, everything happens within the very strong, constant static magnetic field. In order to isolate a slice of the brain you need to set the RF field that you turn on and off to a specific range of frequencies. That way the only information coming back at you will have to be from the slice that resonates at that range of frequencies. That's 1 dimension. In order to get 2 more dimensions you need to do 2 more things. One is that you introduce another field in order to make the changes in the protons' spin dependent on their location. This is called frequency encoding. I don't get how or why this works, but what frequency encoding does is give you another dimension. So now you've got both a horizontal slice, and a vertical range of behaviours across that slice. The other thing you do is called phase encoding. This involves applying yet another field, perpendicular to the other two. I'm not sure, but I think this bit is temporal. So for phase encoding you apply a bunch of different fields in sequence and watch how the protons change. Anyhow. Once you do slice selection, frequency encoding, and phase encoding you get specific 3D data. One important piece of this is a mathematical thingy called the Fourier Transform. Again, I'm in way over my head, but as I understand it, the data that's coming out of the scanner is like a resonant harmonic of all the various frequencies combined into one sine wave. Fourier Transform is a way of looking at that wave and breaking it down into its component frequencies. Or vice versa, or both. I think you can use Fourier Transform to combine frequencies into a single wave and to break them out of a single wave. 3) Okay. Now that I'm totally lost, on completely shaky ground, let me continue. The first representation of the data, before it shows up in "image space" is in "k-space." Whoo! K-space is cool and it looks like some kind of cosmic event. K-space contains all the spatial frequency data from the scan. 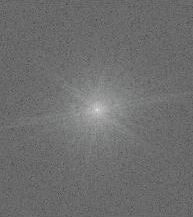 Depending on what sections of k-space you draw information from, you will get different images of the brain at different contrasts, at different resolutions, and/or in different segments. In our next class we will be learning about "the sequence of events (gradients, RF) used to traverse k-space in order to read an entire image." If I can find my way back out, I'll try to make a report. |
|
I'm auditing a class called "Introduction to fMRI." We are using a freeware digital imaging program called FSL (supposedly pronounced "fossil.") Disclaimer in case anyone winds up here because they are looking for actual neuroscience: I'm not a scientist and I don't have a fucking clue what I am doing! Homework: Find the maximal dimensions of the brain along each of the three cardinal axes (front–back, left–right, and top–bottom). Based on your measures of brain dimensions, estimate the total volume of the brain. Because the brain is not a rectangular prism, you will have to make assumptions about its shape within your calculations. 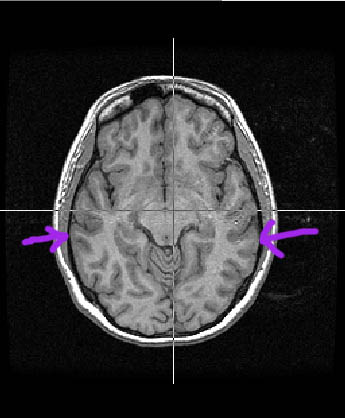 AXIAL VIEW • left–right at widest points: 13.4 cm 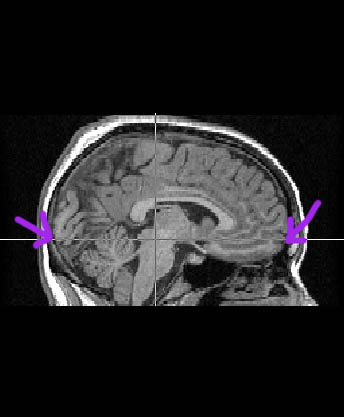 SAGGITAL VIEW • front-back at longest points: 16.3 cm 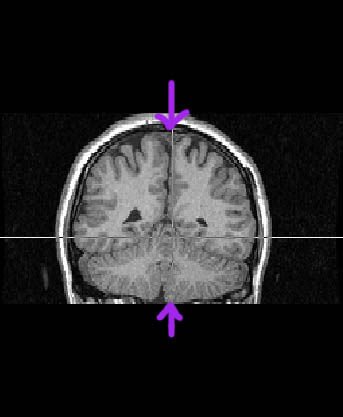 CORONAL VIEW • top-bottom at highest & lowest points: 10.7 cm I calculated the volume as if it was box, using the slices to get the maximum measurements of length, width & depth. I estimated that the area at the bottom/back (cerebellum, etc) is about 1/6 of the total, and about the same amount is missing from the bottom front. So I subtracted 1/6 from the total. 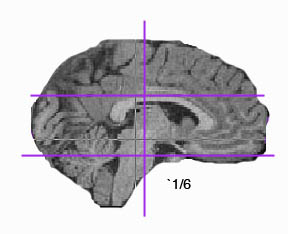
Then I visualized/guessed that if I had a box built to my new dimensions the brain would probably fill about 80% of it. So I took 80% of my new total and it came to 1552 cc. 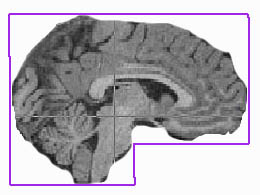 I looked up average brain volumes on the internet and apparently they tend to be between 1300 and 1500 cc. So I'm thinking 80% was probably a bit too generous. OMG I love this class! But thank Christ I don't have to hand in my work. |